Even though the United States is considered one of the richest countries in the world, it also has the biggest wealth gap. In other words, the distribution of money in the United States is more unequal than any other country in the world.
Due to this large wealth gap, at least 37.2 million Americans suffer from poverty, according to the 2020 Census. This number increased by 3.3 million from 2019, demonstrating that the economic situation for the average American is worsening.
Unfortunately, this is not the only shocking poverty statistic. Keep reading to learn more about the current living situation for millions of low income Americans.
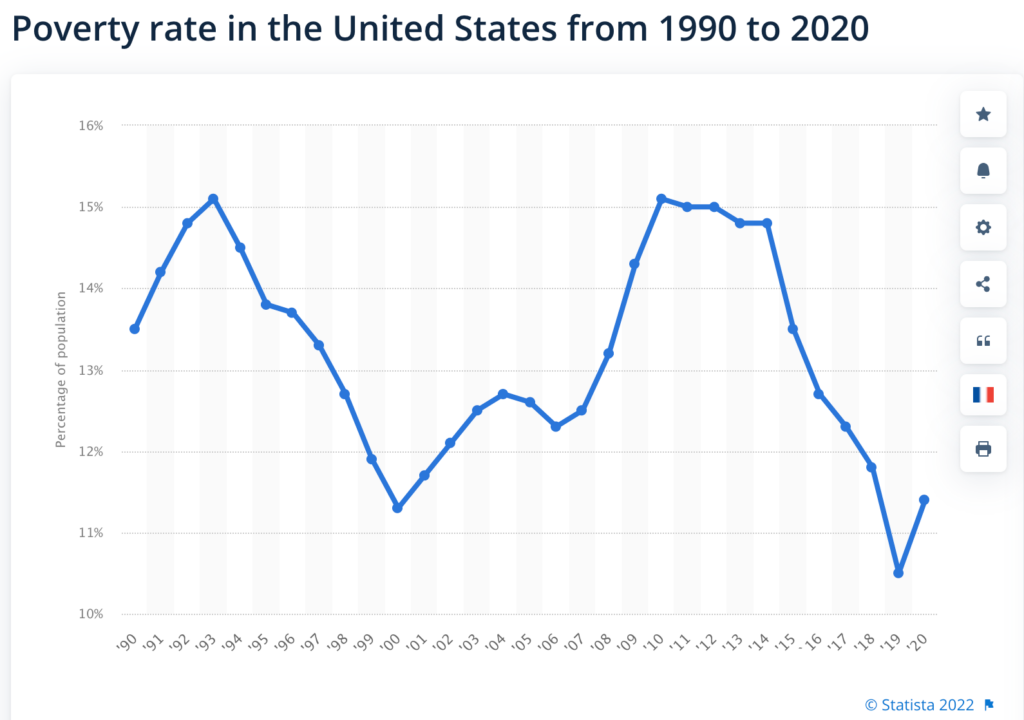
1. As of 2020, about 11.4 percent of Americans were considered poor.
2020 marked the first increase in national average poverty rates, after a 5 year decline.
The US Census Bureau uses a specific income amount to define the “poverty line” in the United States. When a family’s pre-tax income level falls below the amount considered to meet a family’s basic necessities, they are considered poor according to the US government.
2. Americans under the age of 18 are the poorest age group in the US, at about 16 percent.
In 2020, 15.7 percent of males under 18 years old and 16.4 of females under 18 years old were considered poor. Children were the age group with the highest rate of poverty, according to the Statista Research Department. In contrast, Americans between the ages of 65 and 74 years were considered the least poor.
3. Black Americans are the poorest racial group in the United States.
As of the 2020 Census, 19.5 percent of Black Americans were considered poor, compared to:
- 17.0 percent of Hispanics considered poor
- 8.2 percent of non-Hispanic Whites considered poor
- 8.1 percent of Asians considered poor
From 2019 to 2020, however, there was no statistical difference in the rates for Black Americans.
4. Mississippi has the highest rate of poverty in the country, at a rate of about 19.6%.
While Mississippi has the largest group of impoverished Americans, several other states have rivaling rates:
- Mississippi: 19.6% of residents in poverty
- Louisiana: 19.0% of residents in poverty
- New Mexico: 18.2% of residents in poverty
- Kentucky 16.3% of residents in poverty
- Arkansas: 16.2% of residents in poverty
- West Virginia: 16.0% of residents in poverty
- Alabama: 15.5% of residents in poverty
- District of Columbia: 14.6% of residents in poverty
- South Carolina: 13.8% of residents in poverty
- Georgia: 13.4% of residents in poverty
5. 56 percent of the Americans considered poor are women.
According to the US Census, more women experience poverty than men in the United States.
Poverty rates are even higher for unmarried mothers and Latina women. While only 18.1 percent of all women in the US are Latina, they make up about 27.1 percent of all women in poverty. In a similar fashion, Black women are only 12.8 percent of all women in the US, but make up 22.3 percent of all women in poverty.
6. In 2020, about 580,466 people were experiencing homelessness in the United States.
Due to the COVID-19 Pandemic, homelessness in the United States has increased in recent years. Between 2019 and 2020, the number of Americans experiencing homelessness increased by two percent, and was the fourth consecutive year that the rate had increased.
7. As of May 2020, 6 million Americans are unemployed.
According to the Bureau of Labor Statistics, 3.6 percent of working-age Americans are unemployed. In May 2020, at the height of the COVID-19 Pandemic, the unemployment rate hit a shocking high of nearly 15 percent. Since then, it has gradually declined, and has returned to pre-pandemic levels.
8. Detroit, Michigan is the poorest major American city, with about 662,884 residents considered poor.
While Detroit is considered the poorest city with a population of at least 100,000 residents, its poverty levels have decreased in recent years. Over the past 5 years, its rate has decreased by about 4.8 percentage points.
These are the other cities which made the list for the highest percentage of people considered poor, as of 2021 estimates using the 5-year American Community Survey:
- Detroit, Michigan: 662,884 residents considered poor
- Cleveland, Ohio: 374,895 residents considered poor
- Rochester, New York: 198,459 residents considered poor
- Syracuse, New York: 128,804 residents considered poor
- Dayton, Ohio: 128,002 residents considered poor
- Gainesville, Florida: 118,550 residents considered poor
- Buffalo, New York: 248,036 residents considered poor
- Athens, Georgia: 113,756 residents considered poor
- College Station, Texas: 101,925 residents considered poor
- Brownsville, Texas: 180,489 residents considered poor
9. Holmes County, Mississippi is the poorest county in the United States, which has a median household income of a mere $21,504.
An analysis conducted by Forbes found that the poorest counties in the United States are typically in rural areas, rather than in cities or suburban areas.
While the average household in Holmes, Mississippi made an annual income of $21,504, the average household in Loudoun County, Virginia, the richest county in the US, had a median household income of $142,299.
10. As of 2011, about 1.46 Americans were estimated to be living on $2 or less per day.
There is very limited information on “deep” or “absolute” poverty in the United States. However, in 2011, the University of Michigan used the World Bank’s definition of deep poverty as living on $2 a day to make an estimate on how many Americans were experiencing this.
Ultimately, the study revealed that the number of Americans relying on only $2 a day increased significantly since 1996, when only 636,000 Americans relied on this amount.
11. Between 2000 and 2015, the number of Americans considered poor living in the suburbs grew by 57 percent.
According to Brookings, poverty is growing more quickly in smaller metropolitan areas, rather than in cities and rural areas, for the first time in decades.
Brookings reports, “Suburbs saw the number of poor residents living in distressed neighborhoods grow by 188 percent, ahead of small metro areas (172 percent), rural communities (103 percent), and cities (80 percent).”
12. About half of American families struggle to make ends meet, as of a 2019 analysis.
According to the Social Security Administration’s annual wage statistics, about 51 percent of Americans made less than $35,000 annually. Even though not all of these Americans fall below the official national poverty line, they still do not make enough money to live comfortably, according to the LA Times.
Many of these families have parents who work multiple part-time jobs and struggle to find full-time employment which hinders health insurance and other benefits.
Conclusion
If you’re an American who is currently struggling economically, you are not alone. Luckily, Low Income Relief has compiled several resources to help low-income families get help.